Mapping Your Decision Landscape
The Decisions You Can’t See
I thought I was making maybe 30 decisions a day. This was early in building the workflow that would eventually handle 72,000 social media messages a month, and I wanted to know where my time actually went—so I tracked myself for a single day. Every choice, no matter how small. The real number was closer to 200.
Almost none of them felt like decisions. Scan a message, decide it’s not urgent. Glance at an account history, decide this complaint needs a human right now. Spot a pricing question, decide it’s a hot lead worth a personal reply. 30 seconds here, 15 seconds there, dozens of times an hour. They didn’t register as choices. They registered as reading my inbox.
I had no idea—and I was the one designing the system.
That tracking day changed where I aimed the AI. Not at the strategic decisions I would have named if you’d asked me, but at the invisible triage calls actually consuming my attention. If your own estimate is anything like mine was, it’s off by nearly an order of magnitude—and everything this chapter teaches starts with closing that gap.
You can’t improve decisions you can’t see. And if you can’t see your decisions, you can’t figure out where AI would actually help. You end up deploying technology that addresses decisions you rarely make while ignoring the ones consuming your actual time.
Why Decisions Disappear
Experienced professionals make most decisions automatically. That’s what expertise is—pattern recognition so fast it feels like instinct rather than deliberation. A senior support manager knows which tickets need escalation before consciously analyzing them. A veteran salesperson senses when a deal is going sideways before the metrics show it.
That autopilot is exactly what makes experienced people fast. It is also what makes their decisions invisible. When a decision doesn’t feel like a decision, you don’t count it.
Decision blindness comes in three forms:
Routine blindness. Decisions you’ve made so many times they don’t register. The email triage decisions. The “is this worth my time?” assessments. The constant micro-prioritization happening throughout every workday. You’ve made these decisions thousands of times, so they feel automatic—but each one still requires information and judgment.
Bundled blindness. Multiple decisions disguised as a single task. “Prepare for the client meeting” sounds like one thing, but it’s actually a dozen decisions: What topics to cover? Which data to pull? Who needs to attend? What format to use? How much detail to include? When a task contains multiple hidden decisions, you undercount.
Reactive blindness. Decisions hidden in responses to others. When someone asks a question and you answer, you made a decision—what information to share, how much detail to provide, what tone to use. Reactive work feels like responding, not deciding. But every response required judgment.
These three types of blindness explain why most people dramatically underestimate their decision volume. If you can’t see a decision, you can’t identify the information gap. You can’t define a clear task. You can’t know when AI support would help.
The Decision Inventory
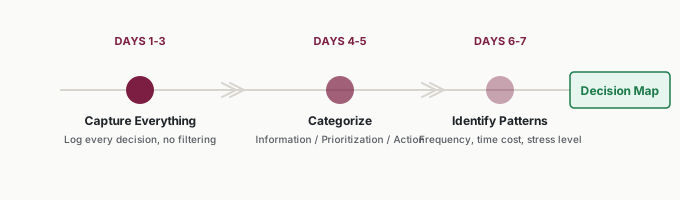
The full version takes a week. Keep a running list—notebook, app, voice memo, whatever works. Log every decision, no matter how small. Don’t filter or categorize yet. Just capture.
Days 1-3: Capture everything. Every time you make a choice, note it. “Decided to answer this email now vs. later.” “Decided this report needs more detail.” “Decided to involve Sarah in the conversation.” The volume will surprise you.
Days 4-5: Categorize. Sort your decisions into three buckets:
- Information decisions: “What do I need to know?” These include research, analysis, synthesis—any decision that requires gathering or processing information before acting.
- Prioritization decisions: “What should I work on next?” These include sequencing, resource allocation, time management—any decision about what gets attention when.
- Action decisions: “How should I handle this?” These include execution choices once you’ve decided what to do—the specific approach, format, tone, or method.
Days 6-7: Identify patterns. Which decisions repeat daily or weekly? Which consume the most time? Which cause the most stress or uncertainty? The patterns reveal your decision signature—the recurring choices that define how you spend your cognitive energy.
When I did this exercise for my own workflow, the biggest surprise was the decisions I didn’t think counted. Choosing which customer messages to prioritize, deciding which complaints needed immediate attention versus a standard response, figuring out which leads were worth a personal reply—none of these felt like “decisions.” They felt like breathing. But each one required information, judgment, and time. Once I started counting them, I understood why my days felt so full even when my to-do list looked manageable.
The Quick Alternative
A week of tracking isn’t realistic for everyone. Here’s a 10-minute version that captures most of the value:
The 10-Decision Sprint:
- List 10 decisions you made today (or will make tomorrow)
- For each one, note: What information did you need? How long did gathering it take?
- Star the three decisions where better or faster information would have helped most
Those three starred decisions are your starting candidates for AI support. They’re high-information decisions that you make regularly—exactly the profile where AI creates value.
The Four Quadrants
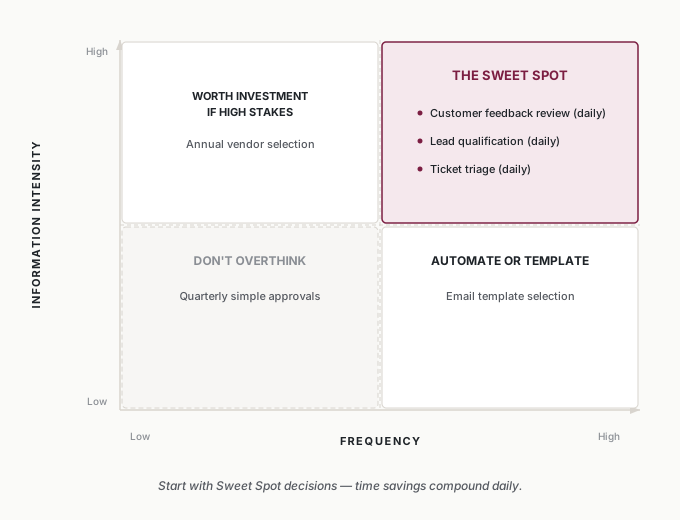
Once you can see your decisions, map them. The most useful framework plots decisions on two axes:
Axis 1: Frequency. How often does this decision occur? Daily/weekly (high frequency) or monthly/quarterly/once (low frequency)?
Axis 2: Information Intensity. How much information does the decision require? High intensity means gathering, synthesizing, and analyzing data from multiple sources. Low intensity means the criteria are straightforward—you just need to make the call.
Four quadrants emerge:
| High Frequency | Low Frequency | |
|---|---|---|
| High Information Intensity | THE SWEET SPOT | Worth investment if high stakes |
| Low Information Intensity | Automate or template | Don’t overthink |
The Sweet Spot: High Frequency + High Information Intensity
These decisions happen often enough to justify setup time, and they involve information problems AI can actually solve. Examples:
- Reviewing customer feedback for patterns (daily, information-heavy)
- Qualifying leads based on multiple data points (daily, information-heavy)
- Prioritizing support tickets by urgency and complexity (daily, information-heavy)
- Preparing for client calls with relevant context (several times weekly, information-heavy)
When AI helps with these decisions, the time savings compound. 20 minutes saved on a daily decision is 80+ hours per year. This is where I started with my own social media workflow—72,000 messages a month, each requiring a triage decision. The volume alone made it a sweet-spot candidate, and the information intensity (checking account history, purchase status, sentiment) sealed it.
The Trap: Low Frequency + Low Information Intensity
Building AI workflows for rare, simple decisions wastes effort. If you make a decision once a quarter and the criteria are clear, just make the decision. Don’t over-engineer it.
The Middle Quadrants
The other two quadrants require judgment:
High frequency, low information intensity: These decisions happen often but don’t require much data gathering. Consider simple automation or templates instead of AI. A decision like “which email template to use for follow-up” might just need a quick reference guide, not an AI system.
Low frequency, high information intensity: These decisions are rare but require significant research when they occur. Strategic planning decisions, major vendor selections, annual budgeting—they’re important but don’t happen often enough to justify dedicated AI workflows. Use AI ad-hoc for research support when these decisions arise, but don’t build permanent infrastructure around them unless the stakes justify it.
The sweet spot decisions deserve your setup investment. The others can wait.
The $45,000 Lesson and the 10-Minute Fix
The Operations Director’s Discovery
Take Kenji, an operations director at a property management company—a composite of the operations leaders I’ve worked with, with numbers rounded from real engagements. His team had invested $45,000 in an AI tool that promised to “optimize operations.” Six months later, nobody used it.
After six months of shelfware, Kenji ran the decision inventory exercise. He predicted 20-25 major decisions per week. The actual count: 132.
The breakdown revealed something he hadn’t expected:
| Decision Category | Count | % of Total |
|---|---|---|
| Tenant escalation triage | 37 | 28% |
| Resource allocation | 29 | 22% |
| Vendor communication | 25 | 19% |
| Budget micro-decisions | 19 | 14% |
| Strategic/planning | 10 | 8% |
| Other | 12 | 9% |
Nearly half his decisions were triage and allocation—quick judgments about who should handle what, and how urgently. These were invisible because they happened in 30-second bursts: glance at email, decide priority, assign or handle.
The $45,000 AI tool targeted strategic planning decisions that happened roughly 10 times per week. The vendor optimized for the 8% while ignoring the 50%.
Once Kenji saw this mismatch, he redesigned his approach. For tenant escalation triage—his highest-volume, highest-information decision—he built a simple AI summary that pulled context from four systems automatically: tenant history, property records, service agreements, technician availability.
Triage time dropped from 8 hours per week to 2.5 hours. Response time to tenants improved 40%. The AI investment finally worked—because it was aimed at the right decisions.
Kenji’s expensive AI tool wasn’t bad technology. It was mismatched technology. The vendor built it for the decisions that sounded important—strategic planning, predictive maintenance—rather than the decisions consuming actual time. Without the decision map, Kenji would have concluded “AI doesn’t work for operations.” With it, he realized the AI was aimed at the wrong decisions.
The Sales Rep’s Sprint
Picture an account executive like Aisha—another composite, drawn from the sales professionals I’ve interviewed. She dismissed AI as “for people who don’t know what they’re doing.” She consistently hit quota but worked 55-hour weeks.
She tried the 10-Decision Sprint anyway—ten minutes, no commitment. Her 10 decisions from the previous day:
- Which prospect to call first
- Follow up on stalled deal vs. new pipeline
- Talking points for discovery call
- Whether to involve solutions engineer
- Responding to pricing objection
- Which case study to send
- Whether to discount to save a deal
- What to include in forecast update
- Prep for technical buyer demo
- Push for CFO meeting now or wait
For each, she tracked the information needed and time to gather it. The pattern was clear: decisions 3, 5, 6, and 9 all required extensive information gathering—30-45 minutes each of searching through CRM, email, Slack, and shared drives.
Aisha started with call prep only. A simple prompt that summarized relevant company news, past interactions, likely objections, and case studies. Instead of 35 minutes of searching, she got a starting brief in 2 minutes that she could verify and adjust.
Call prep time dropped from 35 to 12 minutes. She reinvested the saved time across her day—one extra discovery call, better-prepared demos, faster follow-ups. After eight weeks, her quota attainment climbed from 108% to 127%. The AI didn’t make better decisions. It gave her more time to make decisions herself.
The decisions stayed human. The information gathering became AI-assisted. She still decided which prospects to prioritize, how to handle objections, when to push for meetings. AI just got her the context faster.
Her initial dismissal—“AI is for people who don’t know what they’re doing”—turned out to be half right. AI wasn’t replacing her expertise. It was removing the tedious information gathering that consumed time she could spend using that expertise. The decision map made this distinction visible.
Matching Your Map to the Right AI Approach
Once you have your sweet-spot decisions identified, ask one more question about each: What kind of information problem is this?
- Volume: Too much information to process manually
- Velocity: Information changes faster than you can keep up
- Variety: Information scattered across formats and sources
Kenji’s triage decisions had a variety problem—information lived in four different systems. Aisha’s call prep had both volume (lots of relevant information existed) and variety (scattered across CRM, email, LinkedIn, company news).
The type of problem shapes the type of AI support:
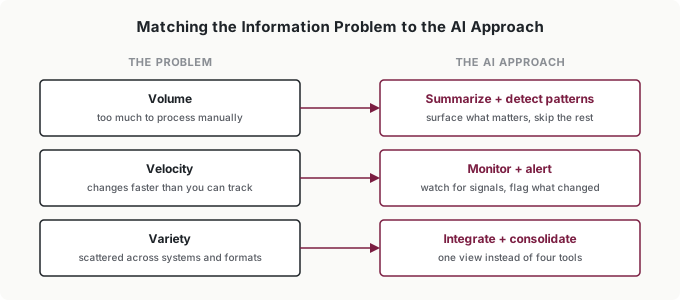
Volume problems need summarization and pattern detection. If you’re drowning in customer feedback, support tickets, or research documents, AI can surface what matters without forcing you to read everything.
Velocity problems need monitoring and alerting. If markets shift, competitors move, or customer behavior changes faster than you can track, AI can watch for signals and surface what’s changed since your last review.
Variety problems need integration and consolidation. If the information you need lives in multiple systems, AI can pull it together so you’re not hunting across four different tools to make one decision.
Kenji’s variety problem needed consolidation. Aisha’s volume problem needed synthesis. Same mapping exercise, different AI approaches—because the information problems were different.
Putting It Into Practice
Kenji’s Second Sweep (Department Leaders)
You read Kenji’s full story above; here’s what he did next, and it’s the move that matters for anyone running a team. He had his three team leads run the same inventory on themselves. The maps overlapped in an expensive way: every escalation he triaged was getting re-triaged by whichever lead received it—same tenant history lookup, same urgency call, made twice. The fix wasn’t more AI. It was routing his existing AI summary to the leads directly, so the second triage started from context instead of from scratch. Your own decision map shows where your time goes. Your team’s maps show where the same decision is being paid for twice.
Aisha’s Six-Month Rerun (Individual Contributors)
Aisha’s Sprint found her call-prep bottleneck; the fuller story is above. The IC lesson came six months later, when she ran the Sprint again. Call prep no longer made her top ten—the workflow had absorbed it. The new stars were forecast updates and post-demo follow-ups, decisions that hadn’t even registered the first time because call prep was drowning them out. A decision map isn’t a one-time audit. Your decision signature shifts every time you fix something, and the ten-minute rerun is how you find the next candidate.
Lena’s Vendor Discovery (Small-Company CEOs)
A founder like Lena discovers something she hadn’t expected when she runs the 10-Decision Sprint: her most information-heavy decisions aren’t client strategy calls. They’re vendor evaluation decisions—which freelancers to assign, which tools to renew, which proposals to prioritize. She makes these decisions 6-8 times a day, and each one requires checking project timelines, budget status, and freelancer availability across three different tools. A simple AI integration pulling those three sources into a daily briefing buys back 45 minutes every morning—time that goes to the strategic work only a founder can do.
Vincent’s Evaluation Problem (Senior Leaders)
For a senior leader like Vincent—a VP of customer experience with four department heads, each running their own AI experiments—the decision map reveals a different kind of problem: his biggest decisions aren’t about his own work. They’re about which of his direct reports’ AI initiatives to fund, expand, or shut down. That’s 15-20 evaluation decisions a week, each requiring him to synthesize information from different teams using different metrics. A weekly AI summary pulling key performance indicators from each team’s dashboards into a single comparison view doesn’t change how his teams use AI. It changes how he evaluates their results—and that changes which initiatives survive.
Common Objections
“This seems like a lot of work for minimal payoff.”
The mapping takes a few hours. Most failed AI implementations took months and thousands of dollars before failing. This investment prevents that. Kenji’s $45,000 AI tool sat unused for six months before he did this exercise—a few hours of mapping would have saved six months of frustration.
“I already know where I need help.”
Most people discover decisions they’d forgotten about. The structured approach reveals opportunities sitting in the decisions you stopped noticing years ago. Kenji thought his pain point was strategic planning. Turns out it was 30-second triage decisions happening 37 times per week.
“My work is too unpredictable to map.”
Even unpredictable work has patterns. You may not know which fire drill is coming, but “handle unexpected urgent request” is a decision type you can map. The trigger varies; the decision structure often doesn’t.
“I don’t have time to track decisions for a week.”
Use the 10-Decision Sprint. Ten minutes now beats months of misdirected AI effort later. If you truly can’t spare ten minutes, that is a sign your decision landscape needs mapping more than most.
“What if my decisions don’t fit neatly into categories?”
They won’t. Real work is messy. Some decisions will span categories, some will resist classification, some will seem trivial until you notice how often they occur. The point isn’t perfect categorization—it’s visibility. A rough map beats no map. You can refine as you learn.
“Won’t the act of tracking change my behavior?”
Yes, and that is a good thing. If tracking makes you more conscious of how you spend cognitive energy, that awareness itself has value. The goal is understanding your patterns, not conducting a double-blind study. Be honest about what you’re deciding, and the map will be useful.
Your Monday Morning Action Item
Do the 10-Decision Sprint from earlier in this chapter. Then take your three starred decisions and plot each one on the frequency-by-information-intensity grid. Which quadrant do they land in? If any sit in the sweet spot—high frequency, high information intensity—you have your first AI candidate.
For each sweet-spot decision, identify the information problem: volume, velocity, or variety. Write one sentence describing what AI support would look like for that decision.
You now have a visible decision landscape. You can’t improve decisions you don’t know you’re making—and now you can see them.